In this follow-up to Lead in Our Tap Water: Providence RI versus Flint MI, I link the data on lead in the tap water at each sampled address with the data on the type of water service line connected to that address. My findings continue to support the conclusion that a significant portion of the lead in Providence tap water is coming from public mains and service lines. The data contradict the suggestion by Providence Water’s media relations representative that the lead is mostly leaching from our private pipes and plumbing fixtures.
Providence Water’s Online Water Service Search Map
Providence Water’s online Search Map allows one to look up the type of public service line connecting the water main to each individual address in its retail service area. As Providence Water notes, “Information about service lines are for public side only. Public side refers to the pipes from the water main to the shut off either in the street or sidewalk. Private side refers to the pipes from the shut off into the building.” The Providence Water search map does not provide information on the private side.
Shown below is an illustrative screenshot from a search for 148 Governor Street, which is the address of my City Councilman Seth Yurdin. The website map indicates that the property has a 0.63 inch lead public water service line. For each of the surrounding properties, an orange dot (•) denotes a lead service line, while a blue dot (•) denotes all other service lines, including copper.

Screenshot from Providence Water’s Online Water Service Search Map. A search for 148 Governor Street shows a lead service line. For each of the surrounding properties, an orange dot (•) denotes a lead service line, while a blue dot (•) denotes all other service lines, including copper. I chose 148 Governor Street solely to illustrate how the search map works. This address was not in the Providence Water database on lead measurements.
Lead Concentrations in Tap Water According to Type of Public Water Service
The online search map provides current data on the type of public water service line. It does not provide historic data on the type of water service line that an address had in the past. Therefore, I restricted my analysis to recent tap water measurements at Providence addresses recorded since January, 2016. During that time period, the database contained 461 tap water measurements at 132 distinct addresses throughout the city. I dropped 7 measurements at 3 addresses for which the online search map did not provide information on the type of public water service. That left 454 lead-in-water measurements at 129 distinct addresses.
The table below shows my results. The rows indicate the type of public water service, while the columns indicate type of sample. In a first-draw sample, 1 liter of water is drawn after at least 6 hours without flushing. All remaining samples include measurements up to 5 liters after flushes lasting from 5 to 20 minutes.
| Proportion of Tap-Water Lead Measurements Equal to or Exceeding 15ppb According to Type of Public Service Line and Type of Sample, Providence RI, Jan. 2016 – May 2017 * | |||
| Type of Public Service Line |
First-Draw Samples** |
All Other Samples |
Total Samples |
| Lead | 13.8% (189) |
40.7% (118) |
24.1% (307) |
| Other | 7.5% (80) |
41.8% (67) |
23.1% (147) |
| Total | 11.9% (269) |
41.1% (185) |
23.8% (454) |
| * Based upon 454 measurements at 129 distinct addresses. Samples labeled “blank” and “spike” have been excluded. Each cell shows the percentage of lead measurements greater than or equal to the U.S. Environmental Protection Agency’s action level of 15 ppb, as well as the number of samples in parentheses. | |||
| ** In first-draw measurements, 1 liter of water is drawn after at least 6 hours without flushing. All remaining samples include measurements up to 5 liters after flushes lasting from 5 to 20 minutes. | |||
When it comes to first-draw samples straight out of the tap, the water in a house connected to lead public service lines is nearly twice as likely to have a lead level exceeding the U.S. Environmental Protection Agency’s action level of 15 parts per billion (ppb). But for all other samples, there’s essentially no difference between houses with lead public service lines and houses without lead public service lines in the proportion exceeding the EPA cutoff.
For first-draw samples, some of the lead could be coming from the private side of the water line or from internal fixtures. After all, properties fed by lead pipes on the public side are more likely to have internal lead pipes and fixtures on the private side. But for the other samples taken after extended flushes from 5 up to 20 minutes, the water must be coming from as far away as the water main. That explains why it doesn’t matter whether the public service line is made of lead, copper or anything else.
Public Versus Private
No matter how you look at it, Providence continues to have a serious problem of lead in its tap water. Of the first-draw samples taken from Jan. 2016 to May 2017, about 12 percent exceeded the EPA action level. Since that proportion is greater than 10%, Providence Water continues to be obligated to take the remedial measures required by the EPA’s Lead and Copper Rule. What’s more, the data contradict the claim that the lead is simply coming from private service pipes and internal fixtures.
Corrections: Dropping Blank and Spike Samples
The map that I displayed in Lead in Our Tap Water: Providence RI versus Flint MI, showing the breakdown by ward, incorrectly included data from 40 “blank” and 40 “spike” measurements out of a total of 1,170 measurements at Providence addresses since 2012. “Blank” measurements are made from water intentionally devoid of all lead, while “spike” measurements are made from water intentionally contaminated with lead. Although both types of control measurements were assigned to specific addresses in the Providence Water database, they were presumably not drawn from tap water samples taken at those addresses.
Below, I show the corrected map excluding these measurements. None of my conclusions change. While Providence Wards 1, 13 and 14 have had lead profiles comparable to the highest risk wards in Flint, Michigan, Providence Ward 2 on the East Side has been the most contaminated of them all.

Percentage of tap water lead measurements equal or greater than 15 ppb in homes sampled in Providence during 2012–2017 according to City Council ward. Numbers of measurements are shown in parentheses. There were inadequate data for ward 6 (only 10 measurements) and ward 15 (only 2 measurements). Data include all measurements, and not just first draws, but exclude 40 blank and 40 spike samples. Source: Analysis of data released by Providence Water.
In Lead in Our Tap Water: Providence RI versus Flint MI, I also displayed a bar graph showing trends within the city of Providence in the 90th percentile lead levels for first-draw samples and all samples from 2012 – 2017. Here’s the correct graph. The blue bars corresponding to “all measurements” now exclude the spike and blank samples. My original conclusions, however, remain unchanged.
The graph shown in Lead in Our Tap Water: Response to Providence Water already excluded spike and blank samples, and thus does not need to be corrected.
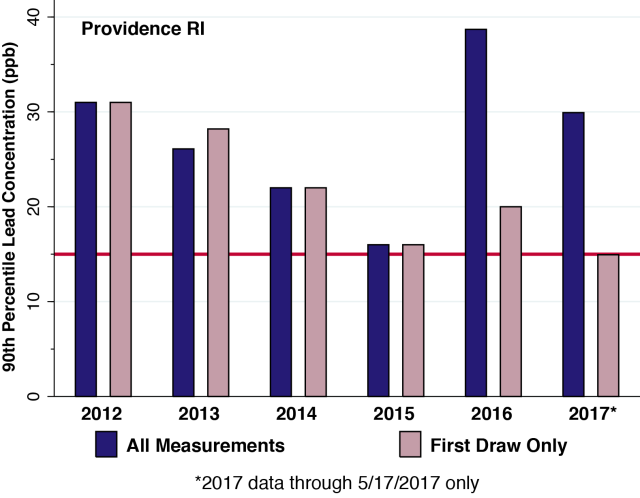
For each year from 2012 to 2017, the vertical bars represent the 90th percentile of measurements of lead in tap water sampled from homes in Providence, Rhode Island. The blue bars represent all measurements excluding spike and blank, while the lavender bars represent only first draws. The horizontal red line represents the Environmental Protection Agency’s action level of 15 parts per billion (ppb). Data for 2017 cover only the period through May 17. Source: Analysis of data released by Providence Water.
This is the third post in the series Lead in Our Tap Water. Here are links to the first post (Providence MI versus Flint MI) and second post (Response to Providence Water).
![]()

Hi there. I’m a Ward 2 resident; thanks for your reporting on this. I’ve got a question about the table in this article: it seems to indicate that the percentage of lead exceeding 15ppb is lower in first-draw samples than in all other samples. Am I misreading that?
If I’m not, that conclusion seems counter-intuitive, to me—I would expect first-draw samples to have the highest percentage of lead exceeding 15ppb of all samples taken. If “All other samples” actually yield higher overall percentages of lead exceeding 15ppb than percentages yielded by first-draw samples, what would be the reason?
LikeLike
Hi Zach, For “All Other Samples,” which include flushes from 5 up to 20 minutes, the water must be coming from as far away as the water main. The fact that these samples have higher percentages of lead exceeding 15 ppb points to the conclusion that the lead is coming from the water mains. This conclusion is reinforced by the fact that the elevated percentages don’t depend on the type of service line (lead or copper) coming into the house. Thank you for your interest. Johanna
LikeLike
I’m somewhat new to Providence. If I had known the water was so bad I would not have moved here with my family. Can you offer any guidance to organizing being done around this issue? I really appreciate all your articles. Thank you for doing such important work.
LikeLike
Hi Sarah, I am not aware of any organizing at present. At an individual level, you can buy a lead testing kit for $10 from Providence Water. According to the company’s website (http://www.provwater.com/node/853), you can obtain a testing kit by calling 401-521-6303 or stopping by 552 Academy Avenue, Providence. I have no information about the reliability of the testing kit. Thank you for your interest. Johanna
LikeLike
Hi Johanna, thank you for this interesting and important analysis. I want to follow up Zach’s question since there’s something that still doesn’t make sense to me. If it is the case that the principal source of lead is the water main (or farther from a residence and point of measurement), how can any first-draw result be lower in lead than a flush result? Thanks very much. (This suggests to me some problem in the original data…. unless there is another driver not visible in the data set you have.)
LikeLike
Hi Steve, It appears that the water main system is not one single conduit, but a series of interconnected pipes. Some of these pipes may be old and corroded, while others have been cleaned or replaced. Accordingly, there can be high amounts of lead coming out of some water mains and minimal or no lead coming out of others. Thank you for your interest. Johanna
LikeLike
Hi Johanna, thanks for this reply. Based only on what you have provided in your articles and replies, I think that more questions need to be asked to reach a conclusive answer. But the key finding should not be lost: in aggregate, presence of lead in our water is far above safe levels. Turning back to your analysis, I think the aggregated data masks what might be revealed with further study: that certain water mains (or routes) produce high amounts of lead and others minimal or none, as you say in your reply to me. It SHOULD be true that if a residence has a low lead presence on first-draw tests, it should ALSO have a low lead presence on flush tests. How could it be otherwise? Your analysis doesn’t get at this (and I don’t know if it is possible with the data set you have). You would have to have both first-draw and flush type tests from the same address. On the basis of the data you show, it appears that the type of public service line (lead or something else) does make some difference: i.e., better to have a copper public service line than a lead line. Question (that I think should be answerable by someone at Providence Water): does water always take the same route from its source (reservoir, treatment plant) to a particular residence? Or do the routes sometimes change? If water always (or almost always) take the same route, then (with the right data), one could map more precisely the most problematic areas. I would think that Providence Water would have, or should have, done precisely this type of analysis on its own. Have you asked them? Thanks again for pursuing this important question.
LikeLike
Hi Steve,
In the entire database of over 4,500 measurements recorded from Jan. 2012 through May 2017 covering Providence and the other cities in Providence Water’s retail service area, I have found only 12 instances where both a first-draw and a flush sample were taken at the same address on the same day. Of these 12 cases, the first-draw showed a higher lead level in 8 and a lower lead level in 2, while in the remaining 2 cases both the first-draw and flush showed undetectable lead levels.
I do not know what criteria Providence Water has used to select specific addresses. Still, regardless of the sampling criteria used, the 5- to 20-minute flush samples measured the amount of lead in water that came from beyond the house. There is no escaping the fact that in a sizable proportion of these flush samples — over 40 percent in Providence during 2016-2017 — the observed lead levels have exceeded the EPA’s action level of 15 ppb.
As to whether there are additional data or analyses that might answer some of your questions, I can only say at this point that Providence Water has not produced them. From my prior post Response to Providence Water, you’re already aware of the comments of its media relations representative to GoLocalProv. When the Fox Point Neighborhood Association recently inquired, Providence Water responded, “Drinking water that leaves the treatment plant in Scituate and journeys through the Providence Water distribution system has no detectable levels of lead. However, in our community some of the service pipes and plumbing fixtures can can contain lead.”
My investigation is ongoing.
Johanna
LikeLike